I have a couple of problems with watching Javascript variables on a local Chrome debugging session.
First - it seems overly difficult to add them, the + - and edit icons in the debug pane are all greyed out.
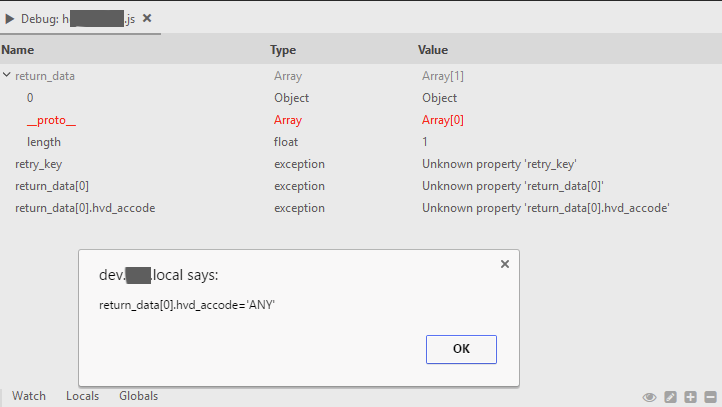
But the bigger problem is that once I have variables watched, they are frequently misreported as “Unknown property”. Debugging in the native IE11 or Chrome debuggers clearly show the variables are well defined and have values.
For example, this image was taken after stepping past a breakpoint set on this alert line
alert(“return_data[0].hvd_accode=’” + return_data[0].hvd_accode + “’”);
---- 2 ------------------------------------------
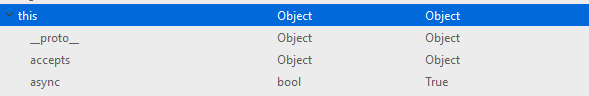
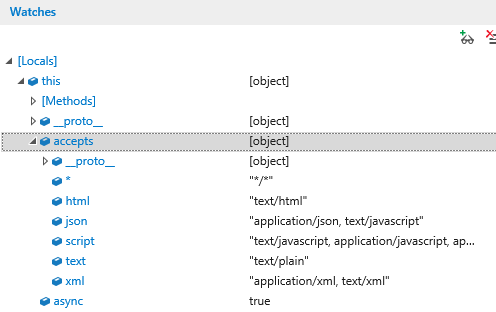
Watched variables can only be ‘expanded’ one level in the Komodo debugger - compared to ‘all’ levels in the Chrome or IE debuggers.
---- 3 ------------------------------------------
The Komodo debugger is reporting “Unknown property” for closures/variables defined in an enclosing scope - such as the “retry_key” variable in the original screenshot. retry_key was defined like this… and is “Unknown” with a breakpoint set inside the success callback.
function ajax_load( oNum ){
var retry_key = oNum;
$.ajax({
type: ‘POST’,
url: “/secure/cart.php”,
data: post_array,
success: function( return_data ){
alert(“retry_key=”+ retry_key);
}
});
}
Thanks
Matt.
(1) Please switch to the “Watch” pane and the “+” should enable. Your screenshot indicates you are in the “Locals” pane.
(2) I’ve logged a new issue: https://github.com/Komodo/KomodoEdit/issues/1794
(3) I don’t know how to reproduce this. In the issues I’ve mentioned above in this thread I have a simple HTML file that has some JavaScript that demonstrates the issue. If you’d be so kind as to help me come up with a similar file that demonstrates the problem, I can file another issue. Many thanks.
While writing a simple example for you, I realised that it was not just closures, but also global variables that were broken. I created the issue on github
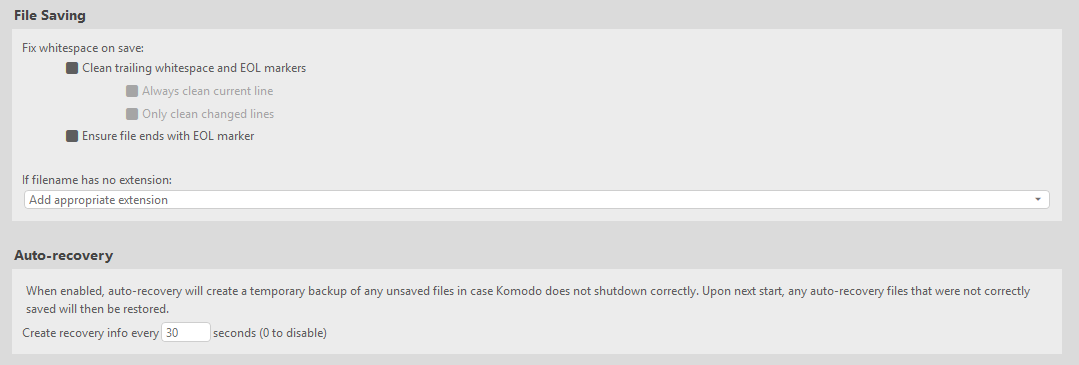
I also have another ongoing problem - the Komodo IDE is randomly freezing once or twice per day - sometimes there is no data loss because Komodo recovers a ‘backup’ file. Other times the backup does not contain the most recent edits. It has been a very long time since I’ve needed to remember every detail of everything I’ve done in the last 15 minutes and it’s just as frustrating now as it was 20 years ago. I don’t know how to reproduce it - it happens randomly about once per day. So far it has only happened while working in my large ish javascript library (~25,000 lines) but that could just be because that is the file I’m editing most often. What’s available to help debug this type of crash?
Sadly I’m not able to reproduce the + not being enabled in the watch window – it’s always enabled for me. However, I’m not debugging a remote page. Maybe that is the trigger. I’ll look more into this.
As for the freezing, 25000 lines in one file is a bit on the large side. There could be a number of “behind the scenes” background threads doing something that could slow things down. @careyh would be better apt to suggest what it could be. My first guess would be the “track changes” feature if you’ve been editing for the past 15 minutes without saving. You can disable “track changes” by going to Edit > Preferences > Editor > Smart Editing > Track Changes and unchecking the box.
If you need to force-quit Komodo then take a look at the end of Komodo’s log file before you restart Komodo and see if there’s anything abnormal. Post anything here and we can help diagnose any potential issues. The log file is “c:/Users/username/AppData/Local/ActiveState/KomodoIDE/10.0/pystderr.log”. Sorry to hear of your troubles here. It’s frustrating indeed
Agreed, 25000 lines is big-ish but the background threads don’t seem to slow anything down, the editor is usually responsive - Komodo has been rock solid in that respect. Code inspections take several seconds to update but that’s to be expected. However, that’s not the problem I was describing - the freezing is a complete crash, Komodo ends up with a “modal” type whiteout overlay, windows reports it as non-responsive and I have to kill it. The longest I’ve left it for was 10 minutes.
I hope that helps you out but I’m sorry to say I’ve now dropped Komodo from my eval and our company will be going with PhpStorm.
@matt42s,
Understood about the eval. Thanks for all the feedback you’ve provided. Theses issues will be resolved in the next release, possibly a nightly as well (which would be sooner but not as soon as it sounds).
If you could do one last thing; get us the log file that @mitchell mentioned above before you restart Komodo during a freeze. That could prove very useful.
You are right that it doesn’t appear to be a background thread since it’s the UI freezing. If you’re done evaluating then we’ll wait for another report of the issue to do further digging but the log file would be much appreciated.